

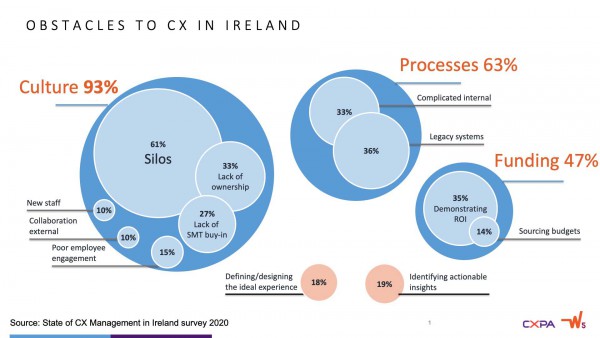
Making the case for investing in and improving CX has never been more relevant. Corona virus restrictions are taxing our ability to offer consistent, high levels of customer experience compounded by the challenge of having to do more with less as results come under pressure. This was an important issue for the CX community even before Covid. In our 2020 State of CX Management survey, 47% of Irish respondents identified demonstrating ROI as a key challenge to their efforts in championing the customer, over 40 percent of CX practitioners claimed they don’t know how to do this work. The need for training and support was clear.
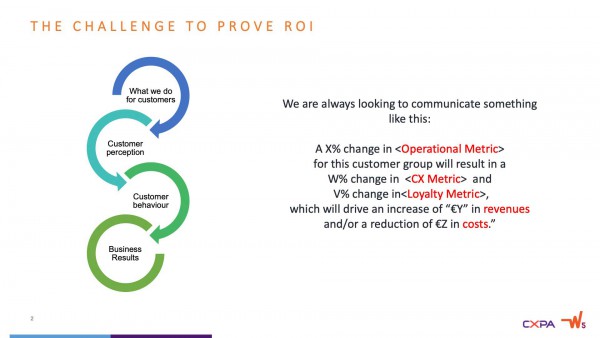
To gain support for CX investment we must make the link to business results. We need to show (all the way to the C-Suite) that what we do for customers has an impact on how customers perceive us. That this perception impacts on what they do, which impacts business results. This impact on results is key - CEOs and Directors are required (by something called their ‘fiduciary duty’) to grow the business and deliver returns to shareholders. Top and bottom line impacts are important.
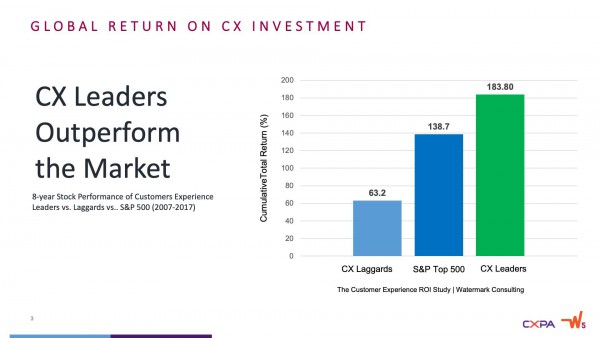
Start with simple quick and easy analyses, using available data. You’ll be surprised how powerful this can be to start a discussion on the value of CX. Most of us know that organisations who excel in CX outperform the laggards, and also the general market. This example from Watermark Consulting is one of many. They are a useful reminder or a prompt to start the conversation. In our experience it is even more powerful to do a similar analysis based on your own data.
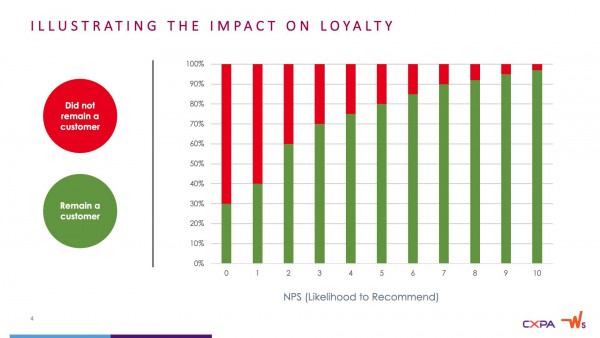
Building the case should remain simple. In the example below we show the relationship between churn data and NPS. Data that most organisations probably already have. Simple – but a clear message. Those most likely to churn are those with low NPS scores. Change the profile, change the business results…
Take a next step then and analyse the impact of changing satisfaction levels on revenue. Bringing us closer to the impact on results in financial terms.
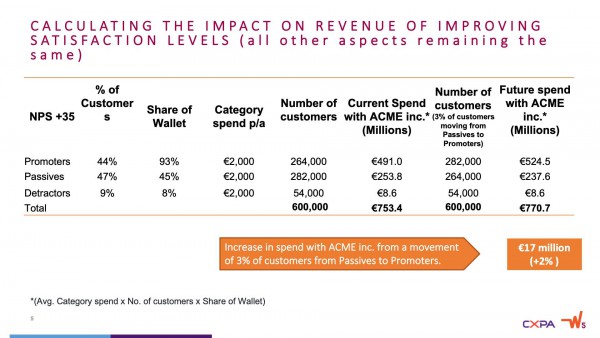
In the example below, NPS is used as a proxy for satisfaction and we calculate revenue gain (€17 million!) by improving NPS/satisfaction. While more sophisticated, the steps are still simple to take and easy to communicate.
Customers with higher NPS scores spend more of their wallet with the company (higher Share of Wallet, SOW)
Calculate the total revenue and revenue contribution for Promoters, Passives and Detractors (number of customers x share of wallet by category spend)
Compare against the total revenue assuming 3% of the base or 18,000 customers moved from Passives to Promoters. Yielding a revenue lift of €17 million from a small move of customers to the promoter category!
This is a simple analysis. It doesn’t include costs of improving CX and assumes that former Passives will react like Promoters. Its value is in its simplicity, providing a starting platform to mobilise and secure CX investment.
When preparing your business case for executives, we recommend a four-stage process:
In preparing the financial case there are some things to bear in mind
Fiduciary Duty
As we mentioned earlier, Company Director’s primary legal fiduciary responsibility is to investors - not customers, not employees and not themselves. This means that the Business case needs to prove the value to investors and the board as a whole should agree.
Cost of Capital
In exchange for providing capital (money), investors expect a healthy return – the level of return expected may vary but it is usually somewhat higher than interest rates offered by banks.
Hurdle Rate
aka the Internal Rate of Return – is the minimum return that the business expects to see from any project. It is always higher than the cost of capital, sometimes substantially higher. To be considered for funding, a project must offer a return at least equal to the hurdle rate.
Tangible Benefits
Tangible Benefits are the quantifiable, monetary returns that a project offers in exchange for investment – higher sales, lower costs, etc. Intangible benefits are typically not expressed in monetary terms (e.g. ‘improved customer satisfaction’). As we have noted earlier in this article most winning business cases focus on tangible benefits.
One of the challenges of CX programs is that success heretofore was often stated in terms of intangible benefits. To counter this, take each intangible benefit, link it to a ‘tangible driver’ that can then be shown to be linked to a tangible benefit. For example, ‘improved customer satisfaction’ can be linked to ‘increased loyalty’ (longer customer tenure). This increased loyalty can be used to calculate an improvement in ‘Customer LifeTime Value’ (CLTV) – a tangible benefit.

Diminishing Returns
One thing we should bear in mind that is that the relationship between return and investment is often not linear – it gets harder (and costlier) to achieve improvements.
Let’s consider the case below:
- Point A shows that there is a cost to delivering even a ‘bad’ experience
- All points (A – B) are equidistant on the Y-axis, representing equal improvements (in absolute terms) in customer satisfaction.
- However, the intervals on the X-axis get progressively bigger as customer satisfaction levels grow.
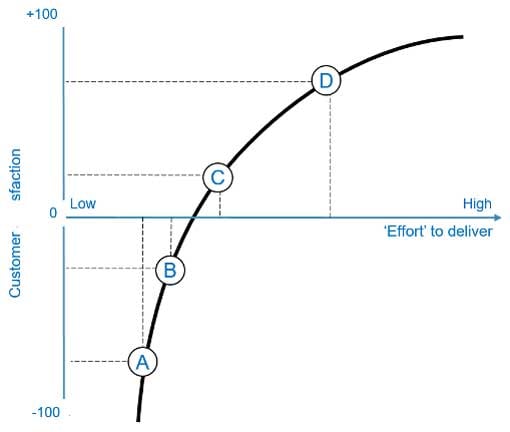
The paradox of CX is this; the better you are, the harder it is to improve and sustain momentum.
Moreover, the relationship between satisfaction and business outcomes (e.g. loyalty) is also not linear. In one case it was clear that, once an ‘acceptable’ level of satisfaction was achieved, other factors (such as price) started to take precedence in the customer’s decision-making criteria.
Costs
Costs can be direct (directly linked to the cost of your goods or services) or indirect (such as ‘overheads’ – rent, utilities, etc.) that are not linked directly to your goods or services.
NB: a reduction in costs can be expressed as a ‘benefit’
Cost Allocation
Cost Allocation is often a point of contention, the internal allocation of costs (and savings). I find that one good way to address this is to develop an internal process flow and associate each step with its cost (both in time and money)
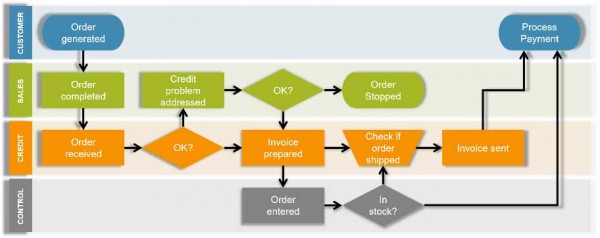
In example above, we can see that two steps in the customer journey involve three separate cost centres and over ten internal steps.
Return on Investment (RoI)
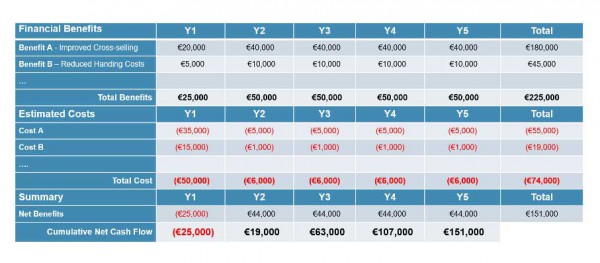
Simply put, the RoI is therefore the difference between the sum of the benefits, minus the sum of the costs in delivering it. However, for a multi-year program, many businesses prefer the Net Present Value (NPV) formula – which is an expression of cash flow impact over several years in today’s terms.
The NPV calculation takes into account the effect of the Hurdle Rate over time, so any project that requires a substantial up-front investment, or has a high Hurdle rate, will appear less attractive.
To make a simple RoI Calculation, RoI = (benefits – costs) / cost (in the example below, (€225,000 - €74,000) / €74,000 = 204% RoI)
Calculating NPV is a little more complicated, but a search online should help.
Capex vs Opex
Capital Expenditure (Capex) is where money is invested upfront in anticipation of future returns, whereas Operating Expenditure (Opex) is the day-to-day costs of running the business. Many businesses prefer to fund projects from Opex – in some cases because there is an effect on tax but usually because funding from Opex over time gives a better NPV result. This is one of the reasons why ‘… as a service’ is so popular – it’s almost all funded from Opex.
Scenarios
When preparing your calculations consider the following scenarios: best case, worst case, likely case, and the impact of ‘no change / do nothing’ and be realistic- don’t inflate returns or minimise / ignore costs.
Time to payback
Many businesses put a time limit on the point at which a project has to recover all its initial costs (breakeven). If a project will take longer than that to breakeven, it may be rejected. This is challenging for some CX projects where the returns may not become evident for two or three years.
The Final Report Should contain the following:
- An Executive summary of no more than 2-sides, including the financial highlights.
- A statement of the background to the report and an analysis of the current situation, including problems / opportunities identified, options considered and potential solutions
- The cost / benefit analysis and an implementation timeline / roadmap, as well as the timeline to breakeven
- Assumptions & risks
- Conclusions
- Clear recommendations, with a statement about what decision / actions is required of the leadership team.
Finally, some tips to guide you in making your case for investment:
1. Prioritise a single view of customer data. To make the link to business results, you will eventually need customer data across all stages of the customer journey.
2. Ensure your data is robust. To convince executives to invest in your project over others the data needs to be defendable, representative of the segment of interest and with a low margin of error.
3. Look for help and advice. There are many in your organisation who deal with these types of analyses. Seek out the help and advice of the CFO team. They will be a good guide as to where to get the data you need and also may help with the analysis. A joint pitch with the CFO as your partner will likely be a lot more convincing than the same argument from you alone.
4. In our experience at W5, many can be overwhelmed by this work. We continue to advise that you start with a tight focus. As you grow in confidence the C-Suite’s confidence in you will also grow as they find your arguments are strong and rooted in financial and business fact.